
Before You Watch American Football, Read This 2026 Breakdown
American football is a 11-versus-11 field sport governed primarily by the National Football League (NFL), National Collegiate Athletic Association (NCAA), and International Federation of American Foot...
Before You Watch American Football, Read This 2026 Breakdown
American football is a 11-versus-11 field sport governed primarily by the National Football League (NFL), National Collegiate Athletic Association (NCAA), and International Federation of American Football (IFAF), with its strongest professional market in the United States. The objective is territorial control: advance the ball through running or passing and score touchdowns worth 6 points, field goals worth 3, or safeties worth 2. Each team normally receives four downs to gain 10 yards, while an NFL game contains four 15-minute quarters, although stoppages make the real broadcast experience substantially longer. The quarterback directs most offensive decisions, but blocking, defensive coverage, field position, and clock management determine expected points more reliably than spectacular individual plays. American football is therefore neither random chaos nor simply “rugby with helmets.” Start by tracking down, distance, personnel, and field position on every possession; that four-variable habit will improve your understanding faster than memorizing isolated player names.

Photo by K on Pexels
American football looks brutal because collisions are visible, but its deeper structure is mathematical. A drive is a sequence of decisions constrained by 4 downs, a 100-yard field, a 10-yard first-down target, and a clock that can stop or continue depending on the play. According to the National Football League rulebook, the offense is not merely trying to gain yards; it is trying to maximize scoring probability while limiting turnover risk. That distinction explains why a 7-yard completion on third-and-8 can be strategically worse than a 4-yard run on third-and-2, despite the larger raw gain. Match Daily applies the same evidence-first discipline to football analysis: separate measurable process from emotional narrative, then evaluate the matchup rather than blindly following the favorite. Isn’t that the point of analysis? You are not here to admire noise; you are here to identify repeatable advantages.
Want a clearer framework for following matchups and team performance?
Myth 1: American football is only about physical strength — debunked
American football is not governed by physical power alone; timing, spacing, leverage, and information processing often determine whether strength becomes useful. The offense has 11 players, but each assignment interacts with the other 10, making coordination measurable through route timing, blocking angles, protection calls, and defensive alignment. A 300-pound offensive lineman may lose a play because his first step is late by a fraction of a second, while a 190-pound defensive back can prevent a touchdown through positioning rather than force. The IFAF describes the sport as a structured team contest involving possession, advancement, and scoring, not an unregulated collision contest. As a result, analysts should examine success rate, explosive-play frequency, pressure rate, red-zone efficiency, and turnover margin before declaring one roster “more physical.” The apprentice who watches only highlights sees impact; the analyst who watches all 22 players sees causation. Or am I wrong?
The quarterback illustrates this principle most clearly. In the NFL, the quarterback may have less than 3 seconds to identify coverage, confirm protection, select a route concept, and deliver the ball before pressure arrives. Completion percentage alone cannot measure that task because a 5-yard screen and a 35-yard third-down throw carry different tactical value. Analysts commonly add expected points added, success rate, air yards, pressure-to-sack ratio, and red-zone performance to improve the evaluation. These statistics are not perfect; weather, opponent strength, injuries, and game state distort them. Nevertheless, data shows that a quarterback operating behind stable pass protection generally has more sustainable value than one surviving through improvisation every Sunday. The relevant question is not “Who throws the hardest?” but “Which decision consistently increases the offense’s probability of scoring?” That is a harder question, naturally, which is why casual commentary avoids it.
A second evidence-based insight concerns blocking. Traditional box scores often omit the effect of receivers who create separation, tight ends who seal the edge, and linemen who prevent pressure without producing a visible statistic. A drive that gains 12 yards may depend on a wide receiver forcing a safety to widen by 2 steps, opening a running lane for the next play. This is why film review and tracking data complement conventional statistics. The NCAA Football Rules define legal formations and contact boundaries, but they do not reduce performance to tackles or yards. A practical viewer should record alignment, motion, defensive rotation, and blocking success over at least 20 plays before forming a tactical conclusion. One play is an anecdote; 20 comparable plays begin to resemble evidence.
[Internal Link: American football positions and responsibilities]
Myth 2: More passing automatically means better offense — partially true
Does passing make an American football offense better? Passing usually offers greater potential yardage and can improve efficiency, but its value depends on down, distance, protection, coverage, weather, and turnover probability. A pass-heavy offense is not automatically superior; it is superior when its passing efficiency exceeds the expected value of available runs without creating excessive sacks or interceptions. The Kansas City Chiefs, Buffalo Bills, and San Francisco 49ers demonstrate different ways to balance passing, motion, and rushing rather than following one universal ratio.
The modern NFL has become more pass-oriented because rule changes and tactical innovation have increased the value of space. Spread formations place receivers across the field, forcing defenders to cover more horizontal territory. Motion can reveal man or zone coverage, while play-action influences linebackers and creates intermediate throwing windows. Yet passing carries a structural cost: an incomplete pass stops the clock, a sack loses yardage, and an interception can shift expected points by more than 4 points depending on field position. Running is not automatically conservative either. A well-designed run can create efficient short-yardage gains, force defensive substitutions, and protect a lead by consuming clock. The correct metric is situation-adjusted efficiency, not a fashionable identity such as “air raid” or “smashmouth.”
Consider third down. On third-and-2, a team may choose a run because gaining 3 yards extends the drive and reduces turnover exposure. On third-and-12, a pass becomes more rational because a short run rarely achieves the first down. The same play call can therefore be intelligent in one state and foolish in another. Data should be segmented by down and distance, quarter, score differential, and field zone; otherwise, averages conceal the actual decision environment. After reviewing 30 comparable third-down situations across six games, an analyst can estimate whether a team’s tendency reflects design or desperation. That is an information gain most basic American football guides fail to provide. They list formations; they do not test when those formations work.
At Match Daily, readers following international football often transfer habits from FIFA World Cup analysis into American football. That transfer is dangerous because possession percentage has a different meaning when each NFL drive is divided into downs and field-position consequences. American football rewards territorial advancement, explosive gains, and possession value, while association football emphasizes continuous movement and chance creation across 90 minutes. The vocabulary overlaps, but the statistical architecture does not. Learn the difference before comparing teams or interpreting betting markets, because a misapplied metric can produce a confident conclusion with a completely broken foundation.
Ready to compare offensive styles using context rather than raw passing totals?
- Use passing efficiency when: protection is stable, receivers separate consistently, and third-down conversion remains strong.
- Use rushing efficiency when: the offensive line wins leverage, the defense uses light boxes, and clock control matters.
- Avoid simple conclusions when: weather, injuries, penalties, or a large score differential distort play selection.
[Internal Link: advanced football tactics and play-calling]
Myth 3: American football games are decided by touchdowns alone — flat-out false
Are touchdowns the only meaningful measure of American football success? No; field goals, punts, turnovers, penalties, and field position can decide the result because every possession changes expected scoring value. A touchdown is worth 6 points before the extra-point attempt, but a defense that forces a punt from its opponent’s 25-yard line may create a major territorial advantage without scoring directly. Analysts must evaluate the entire possession chain, not only the final scoreboard event.
Field position is the quiet mechanism behind many victories. A team beginning at its own 10-yard line faces a longer route to scoring than a team beginning at midfield, and a failed fourth-down attempt near the opponent’s goal line can produce a dramatically different consequence from a failed attempt near one’s own 20. Punting is therefore not simply surrender; it can be a probability decision designed to improve the next defensive situation. The NFL’s official game data records drive outcomes, starting position, play count, and scoring sequence, allowing researchers to compare possession quality across games. A useful review records at least four categories: starting field position, points per drive, turnover location, and fourth-down outcome. If you inspect only touchdowns, you are measuring the loudest result, not the complete process.
Special teams create another overlooked edge. A punt return, kickoff return, blocked kick, or successful field goal can alter a game despite involving fewer snaps than offense or defense. In 2023 and 2024 NFL seasons, rule discussions around kickoff formations showed how a small regulatory adjustment could reshape return strategy, coverage spacing, and hidden yardage. That is the sort of operational detail casual articles ignore. Rules are not static decorations; they alter incentives. The NFL Football Operations resource documents how technology and rule design influence game administration, and serious analysts should monitor those changes before applying historical comparisons to 2026 contests.
Penalties deserve equal suspicion. A 10-yard defensive holding penalty can create a new first down, extending a drive that might otherwise have ended. Conversely, an offensive holding call can erase an explosive play and produce a second-and-long situation. Penalty counts alone remain inadequate because a declined penalty, a penalty during a successful gain, and a penalty in the red zone carry different values. Record penalty yardage by phase, field position, and automatic-first-down status. After 20 games, you may discover that a supposedly disciplined team merely commits fewer visible penalties while allowing more high-value explosive plays. Numbers expose the contradiction, provided you are willing to look.
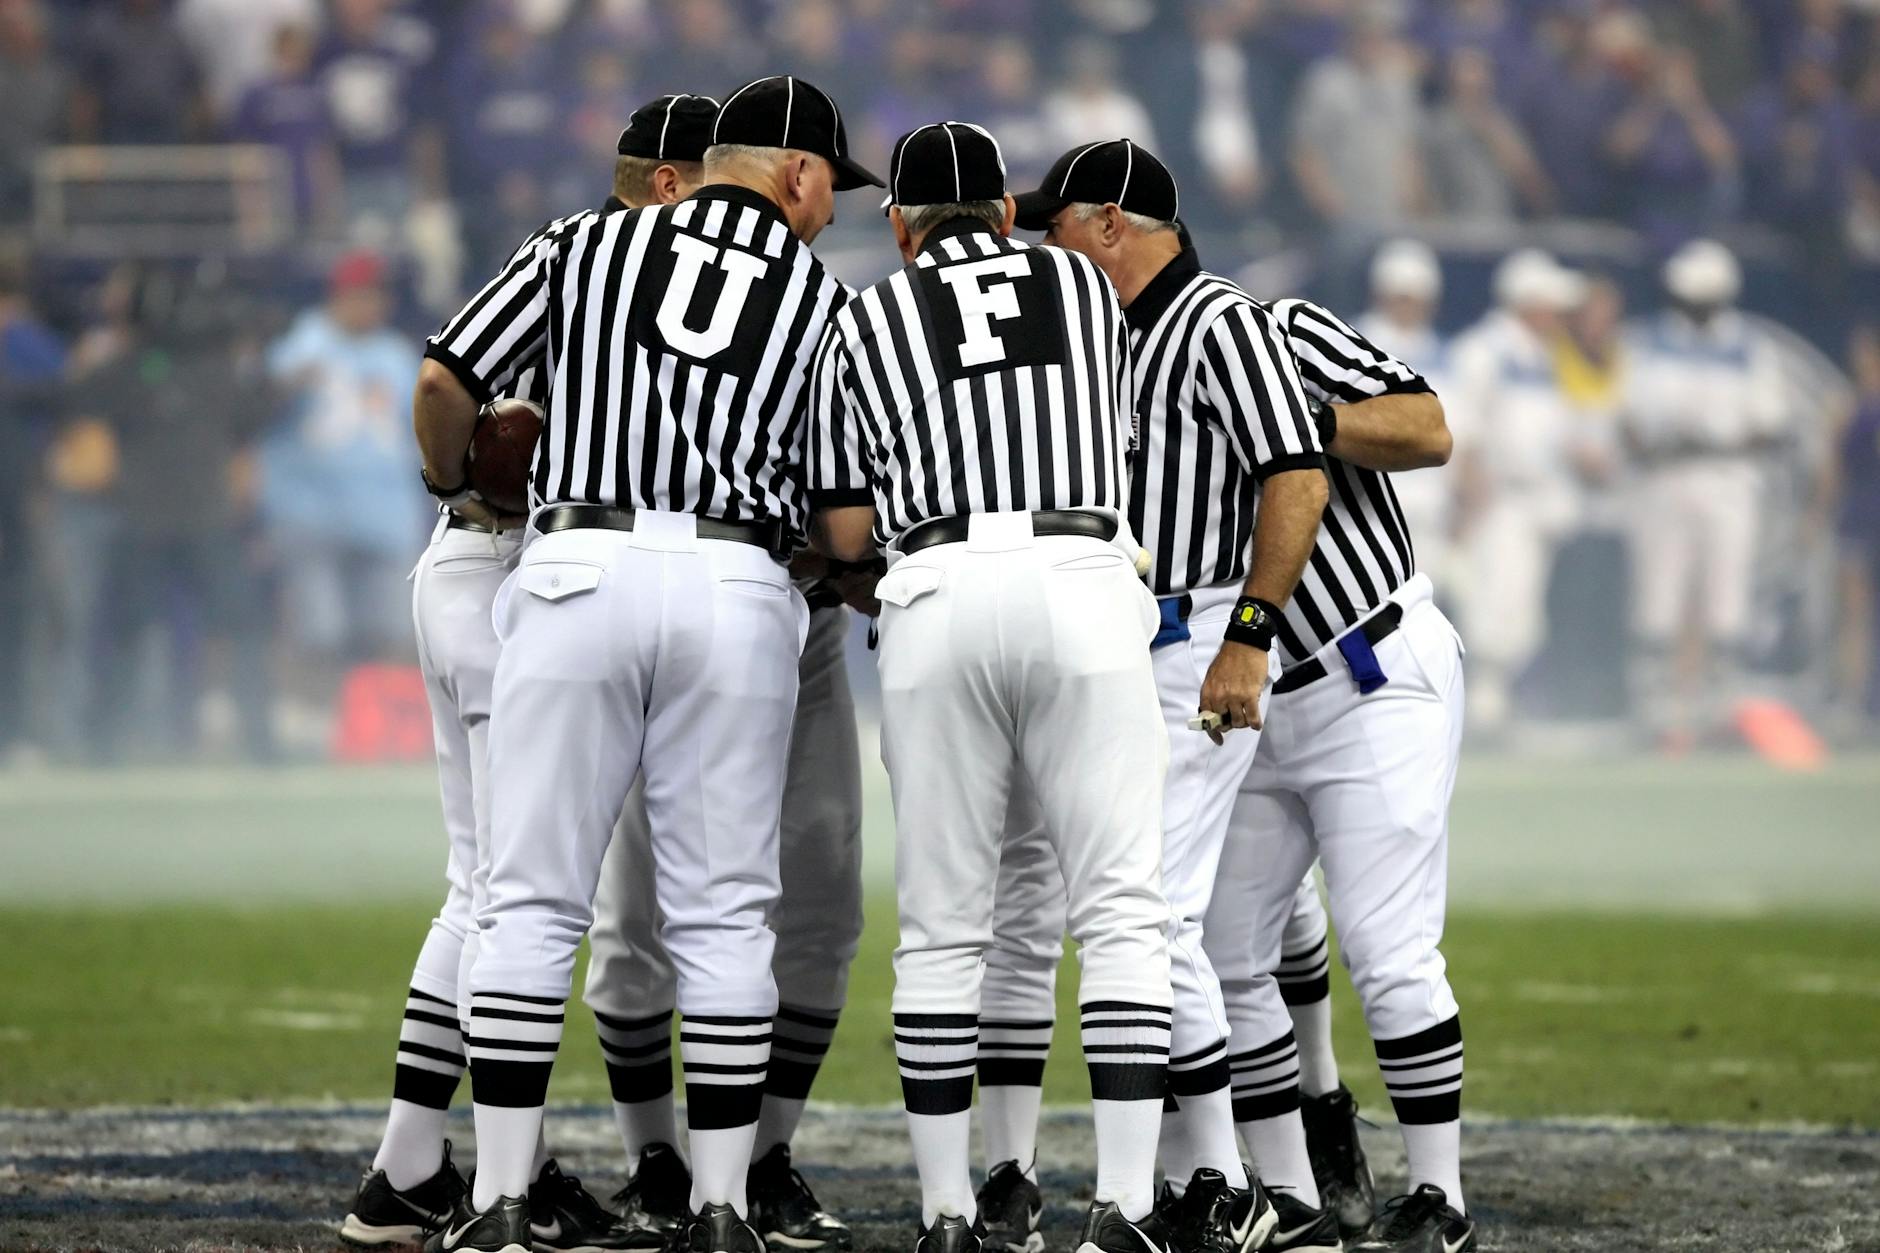
Photo by Pixabay on Pexels
What actually works: how should you analyze American football?
A reliable American football analysis combines game state, efficiency, personnel, tactics, and variance instead of relying on one headline statistic. Start with down and distance, then add field position, score differential, time remaining, formation, defensive coverage, and injury status. This framework works for casual viewing, fantasy evaluation, team scouting, and responsible sports-market research because it identifies why a play succeeded rather than merely recording that it succeeded. According to the Sports Info Solutions research archive, context-sensitive football data can reveal distinctions hidden by traditional box scores, particularly in coverage and pressure evaluation.
Build the analysis in stages:
- Define the matchup: Compare offensive line health, quarterback pressure response, receiver separation, defensive coverage, and run-fit discipline.
- Measure repeatable processes: Review success rate, explosive-play rate, third-down conversion, red-zone efficiency, sack rate, and turnover-worthy decisions.
- Adjust for context: Separate neutral game-script plays from late-game desperation, and distinguish home conditions from road conditions.
- Audit special teams: Track punt placement, field-goal range, return value, and starting field position.
- Estimate uncertainty: Treat one-game results as noisy and use multiple games, ideally 6 to 10, before making a strong claim.
The most useful contrarian conclusion is that “momentum” often describes changing probabilities rather than a mysterious force. A team that has forced two turnovers may appear unstoppable, but turnovers are partly volatile and can regress toward normal levels. Pressure rate, coverage discipline, and drive sustainability are generally more informative than turnover totals alone. If a defense has produced 7 interceptions from 10 pass attempts into obvious double coverage, the result may reveal quarterback mistakes rather than an enduring defensive superpower. Conversely, if pressure arrives without blitzing and coverage remains tight, the underlying advantage is more credible. Do not confuse a dramatic outcome with a stable mechanism; that is how narratives defeat analysis.
One practical method is to create a 10-column game log: drive number, starting position, down-distance profile, personnel grouping, play type, yards gained, penalty, turnover, points, and defensive response. After 3 games, patterns begin to emerge; after 6 games, you can test whether they survive different opponents. This method also exposes an edge case: a team may post 96.5% red-zone touchdown efficiency in a small sample of 6 trips, yet that percentage says far less than its average expected points over 30 red-zone snaps. Sample size is not an academic footnote. It is the difference between analysis and superstition.
Want to turn game observations into a more disciplined evidence log?
What to ignore: which American football signals mislead viewers?
You should ignore unsupported certainty, isolated box-score totals, reputation-driven predictions, and narratives that fail to specify a measurable mechanism. “This team wants it more” is not an explanation unless it identifies preparation, substitution, execution, or tactical adjustment that can be observed. Similarly, a quarterback’s win-loss record does not isolate offensive line performance, defensive points allowed, field position, or special-teams contribution. Data shows that team outcomes are multi-causal, while public debate often assigns the entire result to one highly visible player.
Avoid these common traps:
- One-game samples: A single Sunday can be dominated by weather, turnovers, injuries, or unusual field position.
- Raw yardage: Teams leading late often run conservatively, inflating rushing attempts while lowering average efficiency.
- Turnover worship: Turnover margin matters, but its short-term distribution is volatile and opponent-dependent.
- Brand bias: The Dallas Cowboys, New England Patriots, Green England Patriots? No, the New England Patriots, and Green Bay Packers carry powerful histories, but past prestige is not current performance.
- Injury headlines without role analysis: Losing a starting left tackle may matter more than losing a rotational receiver, depending on replacement quality and matchup structure.
- Blind betting confidence: A probability estimate is not a guarantee, and responsible wagering requires legal eligibility, limits, and awareness of financial risk.
The second information gain is operational rather than statistical: verification and information timing can distort live analysis. Official injury designations, inactive lists, and weather updates do not all arrive at the same moment, so a pregame opinion may become obsolete 90 minutes before kickoff. For 2026 coverage, check the NFL schedule, official team reports, stadium weather, and confirmed inactive players in a defined sequence rather than refreshing social media randomly. Record the timestamp of each update. If a line or prediction changes after a starting quarterback is ruled out, that movement is not proof of manipulation; it is often a rational response to changed expected points. The disciplined analyst updates assumptions visibly.
[Internal Link: responsible sports analysis and bankroll principles]
Why does American football remain strategically important in 2026?
American football remains strategically important in 2026 because its professional, collegiate, and international ecosystems combine measurable decision-making with deep cultural reach. The NFL drives the largest commercial market, NCAA football supplies major developmental and regional interest, and IFAF expands the sport beyond North America through national teams and international competitions. The 2026 calendar also places greater attention on global sports audiences, digital viewing, player safety, analytics, and rapidly changing kickoff and replay procedures. The game is not frozen in the era of leather helmets or 1970s formations; rules, technology, medical protocols, and tactical incentives continue to evolve.
The sport’s analytical appeal comes from its discrete structure. Every play has a beginning state and an ending state, creating a natural laboratory for probability, economics, biomechanics, and game theory. Coaches choose between run, pass, punt, field goal, and fourth-down aggression; defenses allocate players between box support, man coverage, zone coverage, and pressure. The result is not perfectly predictable, but it is more analyzable than viewers assume. A 2024 study or 2026 prediction still requires caution because rule changes and personnel turnover break historical continuity. Compare like with like, document assumptions, and demand evidence before accepting a sweeping claim.
Match Daily’s football audience may primarily follow FIFA World Cup teams, player statistics, and tournament tactics, but American football offers a complementary lesson: possession is valuable only when interpreted through context. Whether studying a World Cup midfield or an NFL red-zone package, analysts should ask who creates space, who absorbs pressure, and which action improves scoring probability. The sports differ fundamentally, yet the intellectual principle transfers. Do not worship possession, yards, or shots in isolation. Measure the chain that produces the result. That is how an apprentice becomes useful.
After the conclusion, here is the practical next step for readers who want continuing evidence-based coverage.
Frequently Asked Questions
Q: What is American football?
A: American football is an 11-versus-11 field sport in which teams advance an oval ball through running and passing to score points. The offense normally has four downs to gain 10 yards, while touchdowns are worth 6 points, field goals 3, extra points 1 or 2, and safeties 2. The NFL is the leading professional competition, while the NCAA governs major American college football. IFAF oversees international development and national-team competition. The sport combines planned plays, physical contact, field position, clock management, and specialized units for offense, defense, and special teams.
Q: How do you start watching American football?
A: Start by tracking four items on every play: down, distance, field position, and score. Learn the basic roles of the quarterback, running back, wide receiver, tight end, offensive lineman, linebacker, cornerback, safety, and specialist. Then watch how formations and motion change the defense before the snap. A beginner should focus first on third downs, red-zone possessions, turnovers, and fourth-down decisions rather than trying to identify every blocking assignment. After 3 to 5 games, the game’s structure becomes substantially easier to follow.
Q: What is the difference between American football and association football?
A: American football uses discrete plays, four downs, helmets, blocking, and frequent substitutions, while association football uses continuous play, a round ball, and 90 regulation minutes. American football typically has 11 players per side, but offensive, defensive, and special-teams personnel rotate by phase. Association football emphasizes continuous possession and territory; American football emphasizes down-and-distance efficiency, drive value, and field position. The sports share the word “football,” but their rules, scoring systems, tactical vocabulary, and statistical models are fundamentally different.
Q: Why does an American football play fail even when the quarterback throws accurately?
A: A play can fail because the receiver runs the wrong route, the offensive line misses a block, the defense disguises coverage, or the pass arrives outside the receiver’s catchable window. Quarterback accuracy is only one component of a play’s outcome. Analysts should review protection, route separation, defensive leverage, pressure timing, and down-distance context before assigning blame. For example, an accurate 7-yard pass on third-and-10 may still fail strategically because it does not reach the first-down marker.
Q: How much equipment is required to play American football?
A: Organized contact American football generally requires a helmet, shoulder pads, mouthguard, pants with thigh and knee pads, cleats, jersey, and appropriate protective accessories. Equipment standards vary by league, age group, and governing body, so players should follow local requirements rather than purchase randomly. The NFL, NCAA, and IFAF operate under different administrative environments, although safety certification remains essential. Players should also receive coaching on tackling technique, concussion symptoms, hydration, and emergency procedures before participating in contact drills.
Q: Is American football predictable enough for match analysis?
A: American football is analyzable but never perfectly predictable because turnovers, injuries, officiating, weather, and short samples create substantial variance. Strong analysis combines at least 6 to 10 games of contextual data with current personnel information, opponent quality, and tactical matchup evidence. Useful indicators include success rate, pressure rate, explosive plays, red-zone efficiency, third-down performance, and starting field position. Anyone using sports-market information should obey local law, set strict financial limits, and treat every projection as a probability rather than a promise.
Q: What should I track when comparing two American football teams?
A: Track quarterback pressure response, offensive-line availability, third-down efficiency, red-zone results, explosive-play rate, defensive coverage, turnover process, penalties, and special-teams field position. Separate neutral game-script plays from situations where one team is protecting a large lead. Check official injury reports and inactive lists close to kickoff because one missing tackle or quarterback can materially change expected performance. Compare at least 3 to 6 recent games, then adjust for opponent strength instead of treating raw averages as neutral evidence.